

Pros
- 24 cores (8 P-cores, 16 E-cores) and 32 threads for intense multitasking
- Advertised maximum clock speed reaching up to 6.0 GHz
- Broad compatibility with both DDR4 and DDR5 memory platforms
- Features integrated Intel UHD Graphics 770
Cons
- Requires a potential BIOS update for Intel 600-series motherboards

Pros
- 14-core hybrid architecture with 6 P-cores and 8 E-cores
- Unlocked clock speeds up to a rated 5.2 GHz
- Equipped with 26MB cache for responsive processing
- Supports modern PCIe 5.0 and 4.0 standards
- Compatible with Intel 800 series motherboards
Cons
- Requires a dedicated discrete graphics card
- Does not include a cooling solution

Pros
- High 5.4 GHz max boost is well suited to gaming workloads.
- Unlocked multiplier gives experienced users tuning headroom.
- AM5 and DDR5 support align with current-generation desktop platforms.
- 6-core, 12-thread layout is practical for gaming and general use.
Cons
- Cooler is not included, so buyers must plan for separate cooling.
- Requires an AM5 motherboard and DDR5 memory, which limits drop-in upgrades for older systems.
- 6 cores may be less ideal for heavy content creation or workstation tasks than higher-core CPUs.
Overview: The AMD Ryzen 5 9600X is a 6-core, 12-thread unlocked desktop processor built on the Zen 5 architecture. It is aimed at users who want a fast, modern CPU for an AM5-based gaming PC or a responsive everyday desktop build.
Performance and features: With a 5.4 GHz max boost, 38 MB cache, and DDR5-5600 support, this processor is positioned for strong gaming responsiveness and smooth multitasking. Select AM5 motherboards can also provide PCIe 5.0 support, which adds future-ready flexibility for compatible components.
Drawbacks and considerations: The main limitation is that a cooler is not included, so total build cost can rise once cooling is added. It also depends on the AM5 platform and DDR5 memory, which makes it less convenient for older AMD or Intel system upgrades.
Verdict: This CPU makes the most sense for gamers and PC builders who want a fast, unlocked Ryzen chip for a current-generation AM5 system. If you want a straightforward upgrade path and value high boost clocks over bundled extras, the Ryzen 5 9600X is a strong fit.
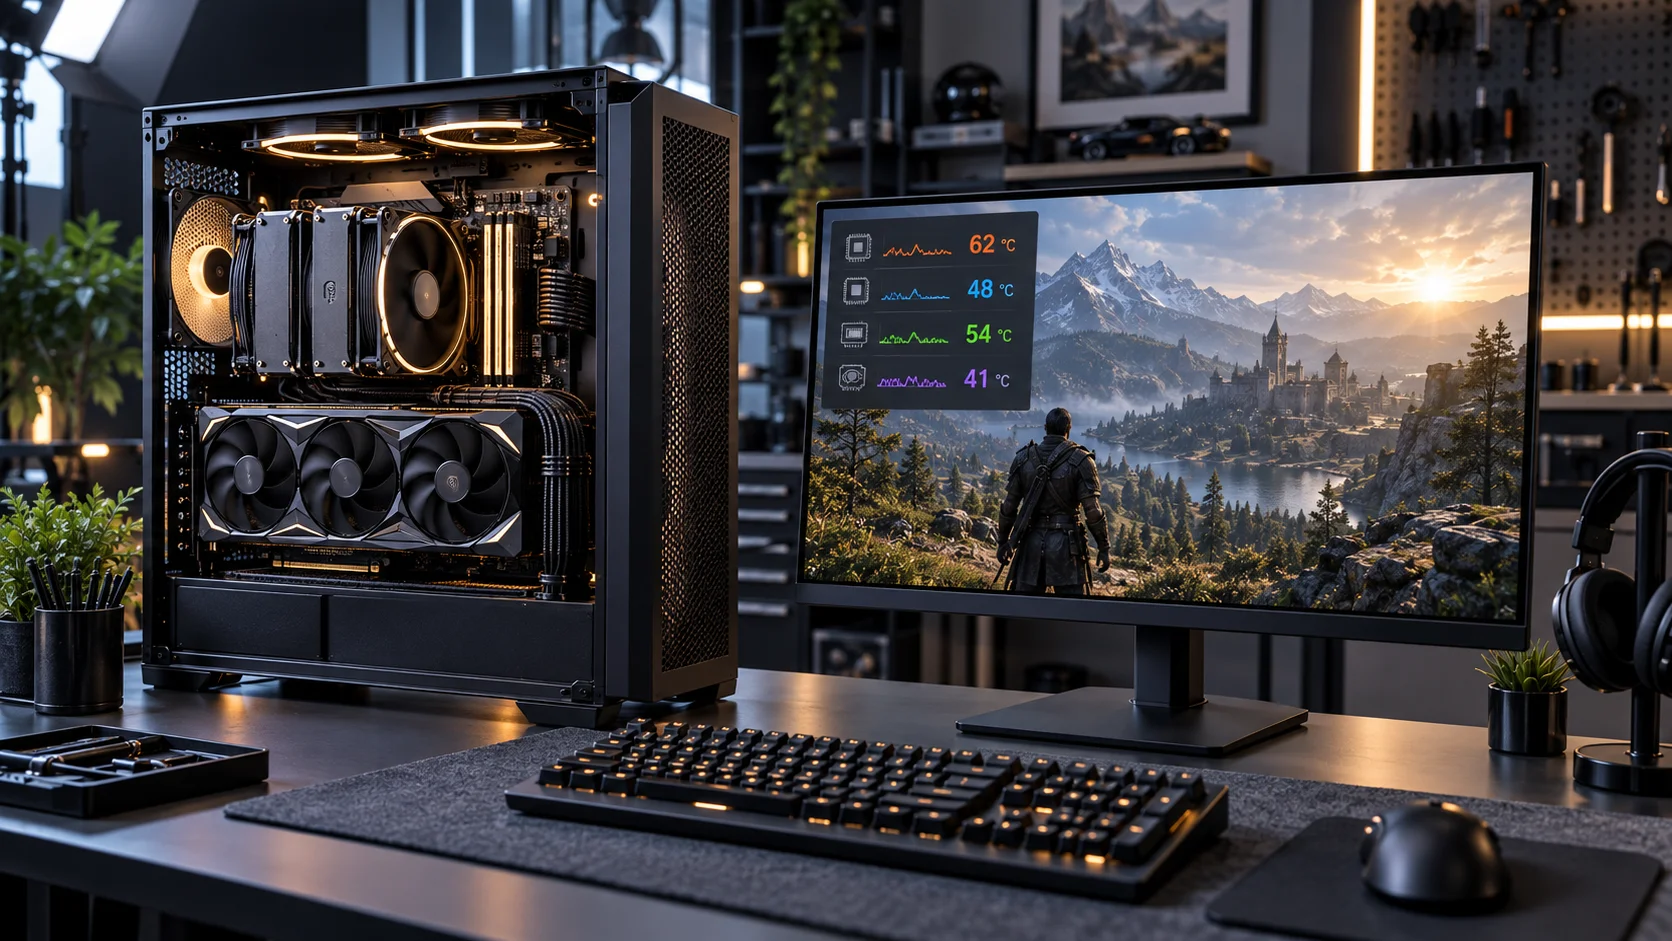
Why In-Game CPU Temperature Monitoring Matters
Thermal throttling kills frame rates silently. A CPU hitting its thermal junction limit, 100 °C on modern Intel Core processors or 95 °C on AMD Ryzen 7000 series, reduces clock speeds automatically to protect silicon integrity. The problem is that most players notice only the symptom: stuttering, dropped frames, or inconsistent 1% lows. Without a live overlay, correlating thermals to those performance events is impossible after the fact.
MSI Afterburner paired with RivaTuner Statistics Server (RTSS) is the field-standard solution for this problem. It reads sensor data through WMI and direct hardware interfaces, overlays it on DirectX, OpenGL, and Vulkan applications in real time, and does so without requiring a second monitor or alt-tabbing. This guide covers the complete setup, sensor configuration, and interpretation of CPU temperature data inside any game.
Understanding your CPU temperature limits before configuring the overlay is essential, knowing the safe operating ceiling for your specific processor determines which alarm thresholds and color triggers to configure inside Afterburner.
MSI Afterburner vs. Alternative Monitoring Tools
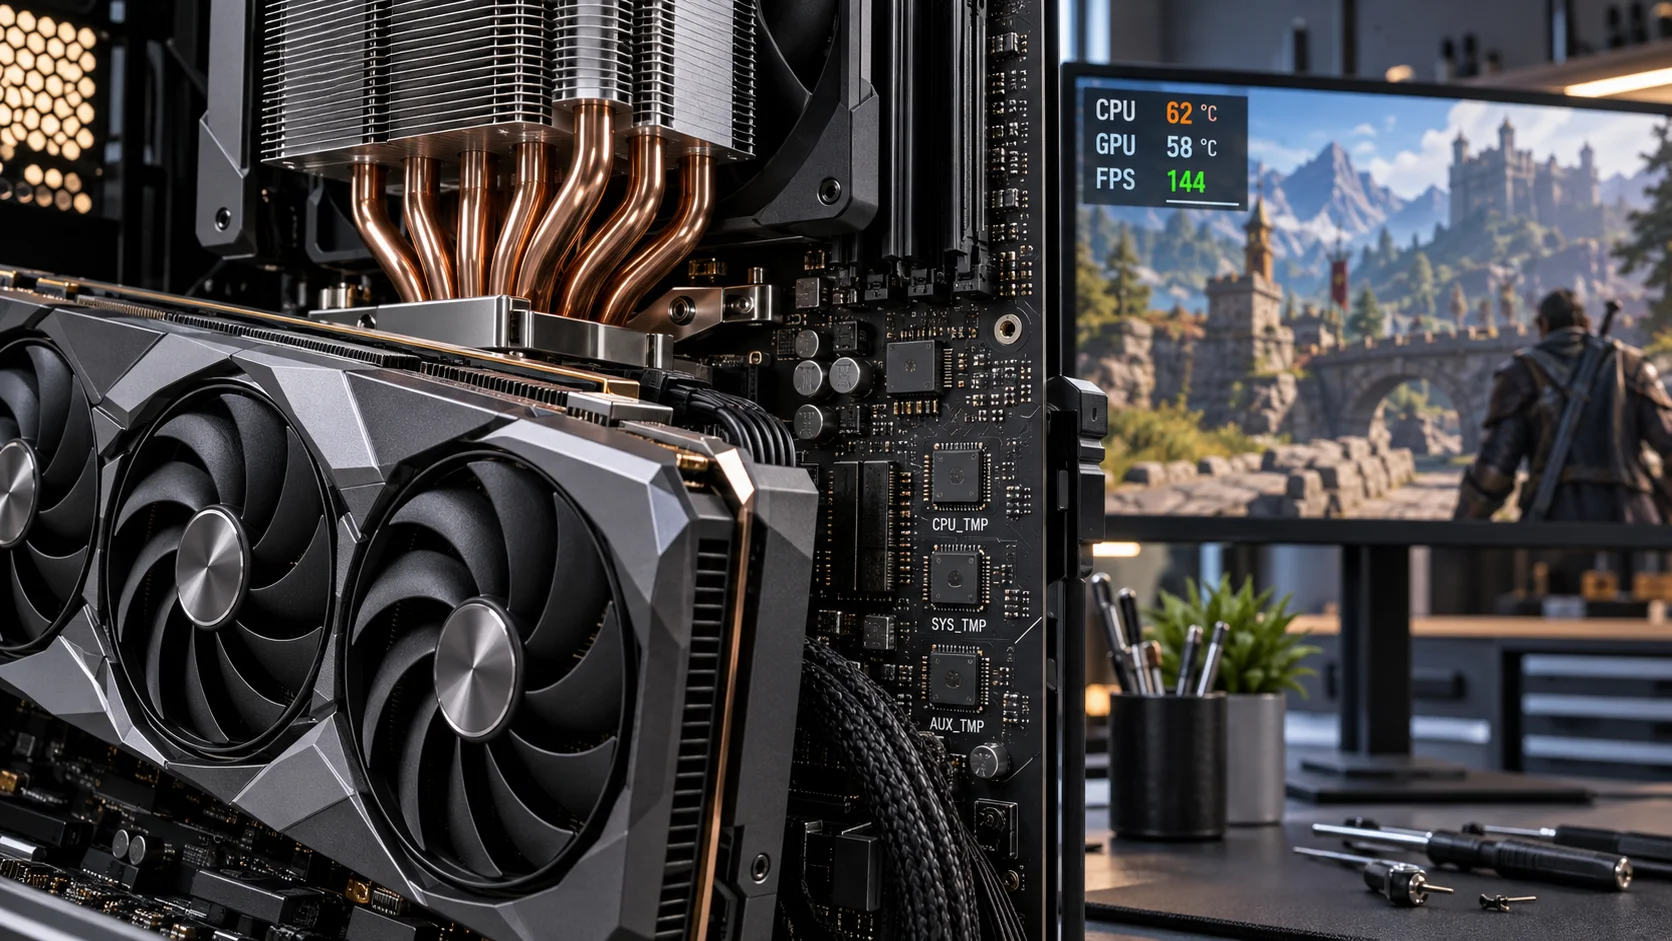
Several tools compete in this space. The table below compares their capabilities across the metrics that matter most for in-game CPU thermal monitoring. For troubleshooting and reliability insights, consult our in-depth what power supply wattage for gaming pc report.
| Tool | In-Game Overlay | Per-Core CPU Temp | CPU Package Power | GPU + CPU Combined | API Compatibility | Cost |
|---|---|---|---|---|---|---|
| MSI Afterburner + RTSS | Yes | Yes | Yes | Yes | DX9/11/12, Vulkan, OGL | Free |
| HWiNFO64 + RTSS | Yes (via plugin) | Yes | Yes | Yes | DX9/11/12, Vulkan, OGL | Free |
| NZXT CAM | Yes | Package only | No | Yes | DX11/12 | Free / Freemium |
| Intel XTU | No | Yes | Yes | No | Intel CPUs only | Free |
| AMD Ryzen Master | No | Yes | Yes | No | AMD CPUs only | Free |
| GPU-Z | No | No | No | GPU only | N/A | Free |
MSI Afterburner wins for combined workflows because it consolidates GPU control (fan curves, overclocking, power limits) and CPU sensor display in one interface, passing data to RTSS for overlay rendering. No other free tool matches that breadth without requiring a separate plugin architecture.
Prerequisites and Downloads
Before installation, confirm these items are in order: Readers comparing setup options can review our technical analysis on how to fix intel arrow lake z890 bios voltage.
- Operating System: Windows 10 version 1903 or later, or Windows 11. Afterburner’s WMI sensor path requires these builds for stable CPU thermal polling.
- GPU Driver: Any recent NVIDIA or AMD driver. If your GPU drivers are in a degraded state, perform a GPU driver clean install first, Afterburner initializes through the display driver stack, and corrupted drivers cause it to fail silently.
- Administrator Access: Required during install and for RTSS to inject into game processes.
- Antivirus Exclusions: Some AV products flag RTSS’s DLL injection. Add the Afterburner and RTSS installation directories to exclusions before installing.
Download both packages from the official MSI source at msi.com/Landing/afterburner. The Afterburner installer bundles RTSS, accept it during setup. Avoid third-party mirrors; the installer is unsigned on unofficial sources and poses integrity risk.
Step-by-Step Installation
Step 1: Run the Afterburner Installer
Execute MSIAfterburnerSetup.exe as Administrator. When prompted about RivaTuner Statistics Server, keep the checkbox enabled. Accept the default installation paths (C:Program Files (x86)MSI Afterburner and C:Program Files (x86)RivaTuner Statistics Server) unless you have a specific reason to relocate them. Complete both installations.
Step 2: Launch and Configure Afterburner
Open MSI Afterburner. On first launch, the main window shows GPU metrics. CPU data is not displayed here , it is configured in the monitoring tab and routed to the overlay. Locate the gear icon (Settings) in the left sidebar and click it. For complementary field maintenance guidelines, examine our breakdown of how to safely connect 12v 2×6 gpu power cable.
Step 3: Configure the Monitoring Tab
Inside Settings, select the Monitoring tab. This panel lists every sensor Afterburner can read, organized by category. Scroll through the list to locate CPU sensors. Depending on your processor, you will see entries labeled:
- CPU1 temperature, CPU2 temperature, … CPUn temperature, per-core readings from the digital thermal sensors embedded in each physical or logical core.
- CPU package temperature, the highest temperature reported across all cores; the most relevant single number for thermal headroom assessment.
- CPU power, total package power draw in watts; useful for identifying whether throttling is power-limit-triggered rather than thermally triggered.
Click CPU1 temperature (or CPU package temperature) to highlight it. At the bottom of the panel, check the box labeled “Show in On-Screen Display.” Optionally, enable “Show in On-Screen Display graph” for a rolling history graph. Repeat this for each core you want visible. For most users, CPU package temperature plus two to four individual core temperatures provides sufficient diagnostic data without cluttering the overlay. To evaluate matched hardware tolerances, consult our detailed overview of motherboard post codes q leds diagnostics.
Also enable CPU temperature under the graph properties and set the polling period. The default 1000 ms (1 second) is acceptable for general monitoring. Drop it to 250 ms if you are chasing short thermal spikes during benchmark bursts.
Step 4: Assign an OSD Toggle Hotkey
Still in Settings, navigate to the On-Screen Display tab. Set a hotkey in the “Toggle On-Screen Display” field. A common choice is Scroll Lock, which is rarely bound in games. This key toggles the overlay on and off without closing Afterburner or RTSS.
Step 5: Configure RivaTuner Statistics Server
Open RTSS from the system tray (it runs minimized by default). The critical setting is Application Detection Level, set it to Low if you encounter games that block the overlay, or High for standard use. The On-Screen Display Zoom slider controls overlay text scale; set between 0.8 and 1.2 for readability at 1080p or 1440p without obscuring the game frame.
Confirm Start with Windows is enabled in RTSS preferences. Both Afterburner and RTSS must be running before launching a game for the overlay to function.
Step 6: Validate Inside a Game
Launch any DirectX or Vulkan game. Press your assigned hotkey. The overlay should appear in the corner of the screen showing GPU framerate, GPU temperature, and, if configured correctly, CPU temperature values. If CPU temperatures are missing from the overlay but appear in the Afterburner Monitoring tab, return to Settings u2192 Monitoring and confirm the “Show in On-Screen Display” checkbox is checked for each desired sensor, then click OK and relaunch the game.
Understanding What the CPU Temperature Readings Mean
Raw numbers require context. A CPU temperature reading without knowledge of the CPU’s thermal design means nothing actionable.
Intel Core (12th, 13th, 14th Generation, Alder/Raptor Lake)
Intel’s performance-core Tj Max is 100 °C. The processor will throttle at this point regardless of cooling. Under sustained gaming load, Performance cores (P-cores) on a well-cooled system typically sit between 65 °C and 85 °C. Efficiency cores (E-cores) run 5 to 10 °C cooler. If P-core temperatures are consistently above 90 °C under a 240 mm AIO, re-evaluate thermal paste application, a dried or poorly spread paste layer adds 8 to 15 °C of delta between the IHS and cooler base. Intel’s official thermal specifications are documented at Intel’s processor technical resources.
AMD Ryzen (7000 Series, Raphael, Zen 4)
AMD Ryzen 7000 CPUs have a Tj Max of 95 °C and routinely operate between 85 °C and 95 °C under all-core load by design, AMD’s firmware actively boosts clocks until the thermal ceiling is reached. Seeing 90 to 94 °C on a Ryzen 9 7950X under gaming load is normal and intended. The relevant alarm threshold for Ryzen is sustained 95 °C with clock speed drops, not the temperature itself.
Per-Core vs. Package Temperature
Per-core readings reflect individual digital thermal sensor (DTS) output. Package temperature is the highest of all core readings reported upstream. For overlay monitoring, displaying CPU package temperature plus the hottest individual core is the most information-dense configuration. When one core runs 15 °C hotter than its neighbors, that indicates a thermal interface uniformity problem or a chip-level variation (common in Ryzen’s CCD architecture).
Overlay Layout Best Practices
An overcrowded overlay degrades readability and distracts from gameplay. Organize metrics in this priority order:
- Line 1: Framerate (FPS) and frametime (ms), primary performance indicators.
- Line 2: GPU temperature and GPU core clock, confirms GPU throttle state.
- Line 3: CPU package temperature, single most useful CPU thermal value.
- Line 4: CPU power (watts), identifies whether the CPU is power-throttling before thermal throttling occurs.
- Line 5 (optional): Hottest CPU core temperature, for per-core granularity when diagnosing specific throttle events.
- Line 6 (optional): RAM usage (MB used / MB total), useful when RAM speed and capacity affect CPU performance, particularly on AMD’s memory-sensitive Infinity Fabric. See the full breakdown of RAM speed and timings for context.
In RTSS, use the Raster 3D or a custom OSD font at 16 to 18pt for 1080p. At 4K, scale to 20 to 22pt. Position the overlay in the top-left corner for most games, it avoids crosshair overlap and minimap interference.
Troubleshooting Common Overlay Failures
Overlay Does Not Appear In-Game
Confirm RTSS is running in the system tray with Application Detection set to Low. Some anti-cheat engines (Easy Anti-Cheat, BattlEye) block RTSS injection. For these titles, RTSS cannot inject an overlay, use a hardware monitor like a secondary screen running HWiNFO64 instead.
CPU Temperatures Show as 0 °C or Are Missing
This occurs when Afterburner cannot access WMI temperature sensors. Right-click Afterburner and run as Administrator. If the issue persists, open Windows Services (services.msc), locate Windows Management Instrumentation, confirm it is Running and set to Automatic. Restart the service if needed, then relaunch Afterburner.
Overlay Appears But Freezes at Launch
A RTSS version mismatch with Afterburner causes static overlay readings. Download the latest RTSS package independently from guru3d.com and reinstall. Ensure both Afterburner and RTSS are the same paired release.
Massive CPU Temperature Spikes to 100 °C During Loading Screens
Loading screens remove GPU bottleneck, causing the CPU to run unconstrained. Frame rates spike to 300 to 1000 FPS during menus, driving all cores to 100% utilization and maximum thermals briefly. Enable an FPS limit in RTSS (typically cap at refresh rate +10%) to suppress this behavior. This also matters for PCIe bandwidth, excess frames stress the bus unnecessarily. If you are running a newer GPU, review PCIe 5.0 compatibility to confirm your slot and cable configuration.
Logging CPU Temperature Data for Long-Term Analysis
Real-time overlay monitoring identifies immediate throttle events. Long-term logging captures recurring thermal problems across sessions. In Afterburner Settings u2192 Monitoring, enable “Log history to file” at the bottom of the panel. Afterburner writes a CSV to C:Program Files (x86)MSI AfterburnerHardwareMonitoring.hml (or a user-specified path) at the configured polling interval.
Open the log in Excel or any CSV parser. Plot CPU package temperature against frametime. Correlation between temperature spikes above 90 °C and frametime spikes above 33 ms (sub-30 FPS equivalent) confirms thermally-induced stuttering, the root cause that the overlay was designed to expose in real time.
When the Overlay Confirms a Problem: Next Steps
If the overlay consistently shows CPU temperatures at or near Tj Max during gaming sessions:
- Reapply thermal paste, compound dries and cracks over 2 to 4 years, raising contact resistance significantly. The correct method and compound quantity are covered in the thermal paste application guide.
- Clean cooler fins and fan blades, dust accumulation reduces airflow and raises thermal resistance across the heatsink. Even 2 mm of dust on fin stacks measurably increases CPU temperatures under load.
- Review case airflow, negative pressure cases starve the CPU cooler of cool air intake. Reconfigure to positive pressure with filtered front intakes and rear/top exhausts.
- Evaluate CPU cooler adequacy, a 65W TDP processor running a stock cooler under gaming load is marginal. A 125W or 253W TDP processor (Intel Core i9-14900K) requires at minimum a 240 mm AIO or high-performance tower cooler.
- Check safe CPU operating temperatures, confirm your processor’s thermal envelope against the limits documented in the CPU temperature limits guide before drawing conclusions from raw numbers.
Conclusion
MSI Afterburner combined with RivaTuner Statistics Server delivers the most complete in-game CPU thermal monitoring available without cost. The setup requires enabling specific sensors in the Monitoring tab, confirming OSD display flags, and running RTSS with appropriate detection settings. The resulting overlay provides real-time, per-core CPU temperature data directly in the game viewport, making thermal throttle events visible the moment they occur rather than discoverable only through post-session log analysis. For any system where gaming performance is inconsistent, the overlay is the first diagnostic tool to deploy, it removes guesswork and isolates whether the problem is thermal, power-limit, or entirely unrelated to the CPU.
Further Reading on Monitoring Tools
An overlay that shows live readings while you play adds a small load of its own, so cross check the numbers with a second tool. Broader reading on electronic component safety under heavy load is available from American National Standards Institute (ANSI).