
Quick Answer
IPC (Instructions Per Clock) measures how many instructions a CPU’s architecture can complete in a single clock cycle. A processor with higher IPC executes more work at the same frequency, meaning a 3.5 GHz chip with superior IPC routinely outperforms a 5.0 GHz chip with a weaker microarchitecture, clock speed alone tells you nothing about real throughput.

Pros
- 24 cores (8 P-cores, 16 E-cores) and 32 threads for intense multitasking
- Advertised maximum clock speed reaching up to 6.0 GHz
- Broad compatibility with both DDR4 and DDR5 memory platforms
- Features integrated Intel UHD Graphics 770
Cons
- Requires a potential BIOS update for Intel 600-series motherboards

Pros
- 14-core hybrid architecture with 6 P-cores and 8 E-cores
- Unlocked clock speeds up to a rated 5.2 GHz
- Equipped with 26MB cache for responsive processing
- Supports modern PCIe 5.0 and 4.0 standards
- Compatible with Intel 800 series motherboards
Cons
- Requires a dedicated discrete graphics card
- Does not include a cooling solution

Pros
- High 5.4 GHz max boost is well suited to gaming workloads.
- Unlocked multiplier gives experienced users tuning headroom.
- AM5 and DDR5 support align with current-generation desktop platforms.
- 6-core, 12-thread layout is practical for gaming and general use.
Cons
- Cooler is not included, so buyers must plan for separate cooling.
- Requires an AM5 motherboard and DDR5 memory, which limits drop-in upgrades for older systems.
- 6 cores may be less ideal for heavy content creation or workstation tasks than higher-core CPUs.
Overview: The AMD Ryzen 5 9600X is a 6-core, 12-thread unlocked desktop processor built on the Zen 5 architecture. It is aimed at users who want a fast, modern CPU for an AM5-based gaming PC or a responsive everyday desktop build.
Performance and features: With a 5.4 GHz max boost, 38 MB cache, and DDR5-5600 support, this processor is positioned for strong gaming responsiveness and smooth multitasking. Select AM5 motherboards can also provide PCIe 5.0 support, which adds future-ready flexibility for compatible components.
Drawbacks and considerations: The main limitation is that a cooler is not included, so total build cost can rise once cooling is added. It also depends on the AM5 platform and DDR5 memory, which makes it less convenient for older AMD or Intel system upgrades.
Verdict: This CPU makes the most sense for gamers and PC builders who want a fast, unlocked Ryzen chip for a current-generation AM5 system. If you want a straightforward upgrade path and value high boost clocks over bundled extras, the Ryzen 5 9600X is a strong fit.
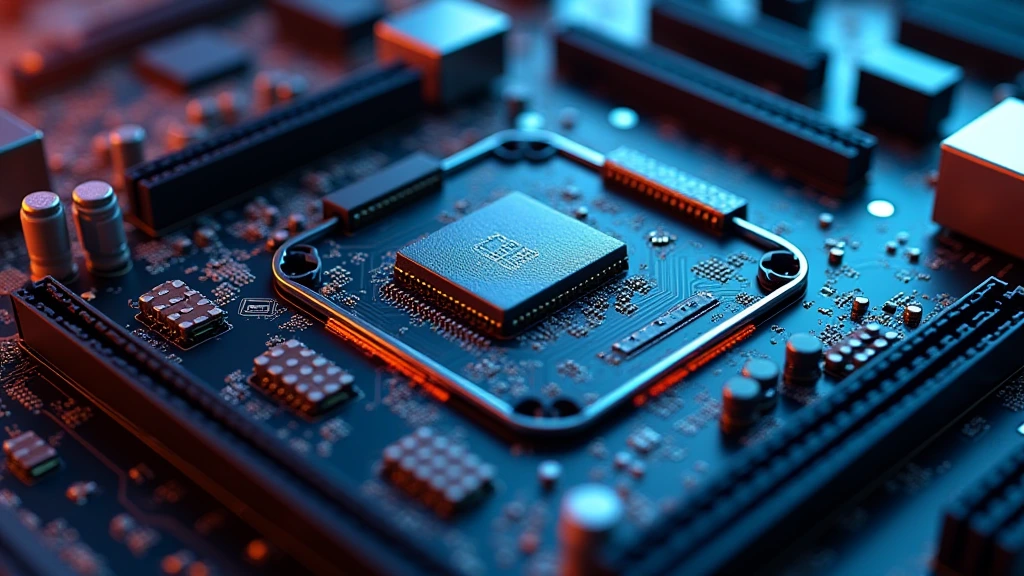
CPU IPC, Instructions Per Clock, is the single most misunderstood metric in consumer processor marketing. Manufacturers push headline boost frequencies because gigahertz are easy to sell. What actually determines how fast a chip processes your workload is the architectural depth behind each clock tick: how wide the pipeline is, how accurately branches are predicted, how efficiently data flows from cache to execution units, and how many operations retire per cycle. Understanding what is CPU IPC is the foundation of every rational CPU purchasing decision in 2026 and beyond. This guide dismantles every layer of that architecture, gives you the diagnostic tools to compare processors correctly, and explains exactly why a lower-clocked modern CPU demolishes higher-clocked silicon from two generations prior.
The Formal Definition: What IPC Actually Measures
Instructions Per Clock is the arithmetic ratio of total instructions retired divided by total clock cycles consumed to retire them. In an ideal, infinitely wide, perfectly fed processor, IPC would equal the number of execution ports , a theoretical ceiling no real silicon reaches. Real-world IPC is always lower due to pipeline stalls, cache misses, branch mispredictions, data hazards, and structural hazards inside the core. Users looking for related component recommendations can explore our custom cpu fan curve breakdown.
Retired vs. Dispatched Instructions
A critical distinction is retired instructions versus dispatched instructions. Modern out-of-order cores speculatively execute instructions before confirming they are on the correct path. Only instructions that pass the commit stage and are confirmed correct are “retired.” IPC counts only retired instructions. When a branch misprediction flushes the pipeline, those speculative instructions are squashed, wasted cycles that directly reduce effective IPC. This is why branch predictor accuracy is one of the highest-leverage architectural improvements CPU designers pursue, and why Intel publishes detailed predictor topology data in its Intel Architecture Technical Documentation.
IPC Is Workload-Dependent
There is no single, universal IPC number for a processor. A chip running a tight integer loop with perfect cache locality will post dramatically different IPC than the same chip running a pointer-chasing database traversal that produces constant L3 misses. Synthetic benchmarks like SPECint 2017 and Cinebench R24 each stress different architectural subsystems, which is why two CPUs can trade wins across different tests. Always contextualize IPC figures to the workload class you actually care about, gaming, video encoding, compilation, or scientific compute.
The Microarchitectural Pillars That Drive IPC
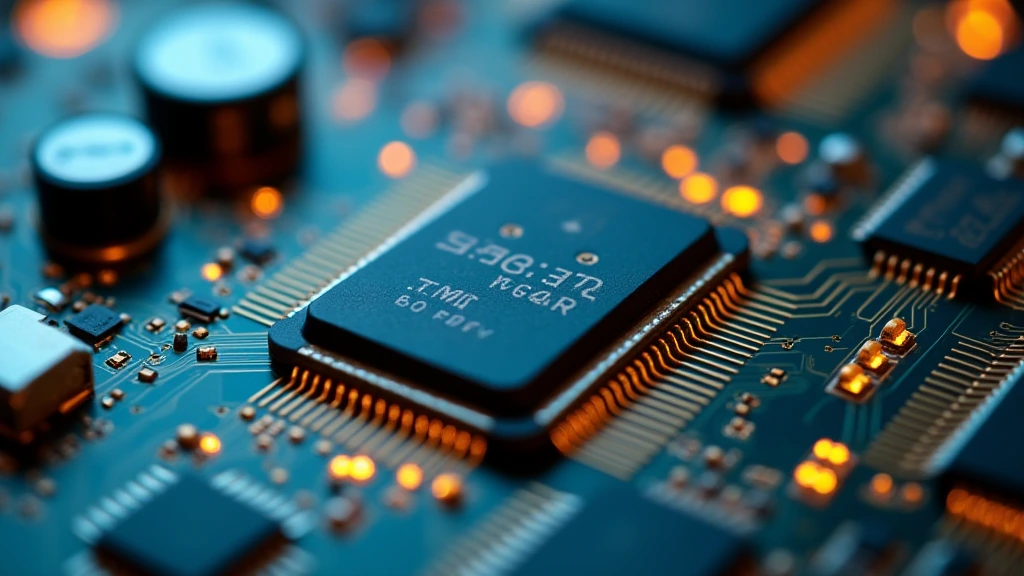
Six concrete architectural subsystems determine how many instructions a core retires per clock. Improving any one of them raises effective IPC without touching the frequency multiplier. Before finalizing equipment decisions, refer to our comprehensive how to choose cpu cooler comparison.
1. Pipeline Width and Dispatch Bandwidth
Superscalar CPUs decode and dispatch multiple instructions per cycle. Intel’s P-cores in Meteor Lake and Arrow Lake dispatch up to 6 micro-ops per cycle. AMD’s Zen 5 architecture dispatches up to 8 micro-ops per cycle, the widest frontend in mainstream x86 history. A wider front-end feeds more execution units simultaneously, raising the IPC ceiling. However, width alone does not guarantee throughput; the backend must have enough execution ports to consume what the frontend delivers, and the instruction stream must be free of dependencies that force serialization.
2. Out-of-Order Window Size (ROB)
The Re-Order Buffer (ROB) is the in-flight instruction pool the processor draws from to find independent operations that can execute while a stalled instruction waits. Larger ROBs let the CPU look further ahead and find more parallelism. Zen 5 expands the ROB to 448 entries. Intel’s Lion Cove P-cores in Arrow Lake use a 512-entry ROB , the largest in mainstream desktop history at launch. Bigger ROBs directly translate to higher IPC under workloads with long-latency operations such as cache misses or division instructions, because the CPU has more candidate instructions to schedule around the stall. For broader ecosystem context, read through our operational guide on thermal paste shelf life.
3. Branch Prediction Accuracy
Every mispredicted branch flushes the pipeline and wastes cycles equal to the branch penalty, typically 15 to 20 cycles on modern deep pipelines. At 5 GHz with a 15-cycle penalty, a 1% misprediction rate on a branch-heavy workload discards an enormous amount of compute capacity. Modern predictors use hybrid neural/TAGE structures with history tables exceeding 10,000 entries. AMD’s Zen 4 and Zen 5 predictors ship with improved indirect branch path history, cutting misprediction rates in workloads like JavaScript engines and interpreted languages where indirect calls dominate.
4. Cache Hierarchy Latency and Bandwidth
A stalled execution unit waiting for data from memory contributes zero IPC. Keeping data close to the core , in L1, L2, and L3 , is therefore a direct IPC amplifier. L1 data cache latency is typically 4, 5 cycles. L2 latency is 12, 16 cycles. L3 latency climbs to 40, 60 cycles. DRAM latency reaches 60, 80 nanoseconds, which at 5 GHz translates to 300, 400 wasted cycles per miss. Architects compensate with hardware prefetchers , engines that predict future memory access patterns and fetch data before the core requests it. Better prefetchers raise effective IPC in memory-bound workloads without changing clock speed or frontend width. For troubleshooting and reliability insights, consult our in-depth bad psu damage cpu report.
5. Execution Unit Count and Latency
Even with a wide frontend and large ROB, IPC is bounded by execution unit availability. If all integer ALU ports are occupied and a new integer instruction arrives, it stalls. Modern CPUs multiply execution port count for high-demand operation types. For example, Zen 5 adds a fourth AGU (Address Generation Unit) to handle four simultaneous memory address calculations per cycle, a targeted fix for workloads that issue many load/store operations. Reducing execution latency on common operations (e.g., cutting integer multiply from 3 cycles to 2) also raises IPC by freeing ports sooner.
6. Instruction Set Extensions
AVX-512 and AVX-10 widen the data path, allowing a single instruction to operate on 512 bits of data instead of 128 or 256 bits. For vectorizable workloads , linear algebra, image processing, audio codecs, ML inference , this multiplies effective IPC by 4u00d7 versus SSE4 code on the same physical core count and frequency. Software must be compiled to target these extensions; otherwise, the potential IPC gain sits unused. This is why compiler version and compile-time flags are hardware-relevant for benchmarking. Readers comparing setup options can review our technical analysis on high cpu usage fix.
IPC vs. Clock Speed: The Real Performance Equation
CPU performance in a single-threaded workload is fundamentally: Performance = IPC u00d7 Clock Frequency u00d7 Core Count (for embarrassingly parallel work). For gaming, which is predominantly single-threaded or lightly threaded, the IPC u00d7 Frequency product for one P-core dominates. This relationship exposes the flaw in comparing raw gigahertz: a chip running at 4.0 GHz with 20% higher IPC than a 4.5 GHz competitor delivers more instructions per second despite the frequency deficit.
A Concrete Generational Example
Intel’s Core i9-12900K at 5.2 GHz boost versus an Intel Core i9-10900K at 5.3 GHz boost illustrates this. The 10th-gen Comet Lake chip has a higher clock ceiling yet is consistently 15 to 25% slower in IPC-sensitive workloads because Alder Lake’s Golden Cove architecture improved the branch predictor, doubled the L2 cache, widened the ROB, and added execution ports. The frequency gap is irrelevant, IPC dominates the result.
Where Clock Speed Still Wins
For workloads that are inherently serial and cache-resident, small single-threaded loops that fit entirely in L1, IPC differences between modern architectures compress, and frequency becomes the primary differentiator. Competitive gaming at very high frame rates (300+ FPS) sits in this regime because the game loop is tight and cache-warm. This is why high-frequency parts still matter for esports titles. But for productivity, compilation, and content creation, IPC dominates. See our desktop CPU benchmarks & reviews for workload-segmented data covering 2024 to 2026 platforms.
IPC in Practice: Comparing 2025 to 2026 Mainstream Processors
The table below compares the key IPC-determining architectural parameters across the dominant desktop platforms shipping in 2026. These specifications are derived from published microarchitecture documentation and verified silicon analysis.
| Microarchitecture | Platform / Brand | Decode Width (u00b5ops/cycle) | ROB Size (entries) | L2 Cache (P-core) | IPC Delta vs. Prior Gen |
|---|---|---|---|---|---|
| Zen 3 (Vermeer) | AMD Ryzen 5000 | 6 | 256 | 512 KB | +19% vs. Zen 2 |
| Zen 4 (Raphael) | AMD Ryzen 7000 | 6 | 320 | 1 MB | +13% vs. Zen 3 |
| Zen 5 (Granite Ridge) | AMD Ryzen 9000 | 8 | 448 | 1 MB | +16% vs. Zen 4 |
| Golden Cove (Alder Lake) | Intel 12th Gen | 6 | 512 | 1.25 MB | +19% vs. Cypress Cove |
| Raptor Cove (Raptor Lake) | Intel 13th/14th Gen | 6 | 512 | 2 MB | +3% IPC, +cache lift |
| Lion Cove (Arrow Lake) | Intel Core Ultra 200S | 6 | 512 | 2.5 MB | +9% IPC vs. Raptor Cove |
For a head-to-head applied analysis of how these architectural differences translate to real benchmark scores across gaming and productivity, read our AMD Ryzen 5 9600X vs Intel Core Ultra 5 245K comparison, which stress-tests both chips across IPC-sensitive and frequency-sensitive workloads. Platform choice, including motherboard power delivery and memory subsystem, also affects sustained IPC; our ASUS ROG Maximus Z890 Hero vs MSI MEG Z890 ACE board comparison covers how VRM topology affects sustained all-core performance under long-duration loads where thermal throttling compresses effective IPC.
How to Measure and Benchmark IPC Yourself
Using Performance Monitoring Counters
Every modern CPU exposes hardware performance counters via PMU (Performance Monitoring Unit) registers. On Windows, Windows Performance Recorder with CPU sampling captures IPC through the Instructions Retired and CPU Cycles counters. On Linux, perf stat -e instructions,cycles ./your_binary reports IPC directly. The output ratio of instructions:cycles is your application’s real-world IPC. Values above 3.0 indicate excellent parallelism extraction; values below 1.0 indicate severe memory-bound stalling.
Standardized Benchmarks as IPC Proxies
SPECint 2017 Rate-1 (single-threaded) is the gold standard for isolating IPC because it normalizes for clock frequency by reporting throughput relative to a reference machine. Cinebench R24 single-thread is a widely accessible proxy that correlates well with gaming IPC. LLVM compilation time (measured in seconds for a fixed source tree) is a practical IPC proxy for software developers. Avoid benchmarks that bottleneck on disk I/O, GPU, or network, these introduce noise that masks the CPU’s instruction throughput. If you are evaluating a system build around GPU compute, our graphics card tests & GPU guides separate GPU-bound from CPU-bound frame generation so you can isolate where the actual bottleneck lives. For GPU-memory tradeoffs at the system level, the Radeon RX 9060 XT 8GB vs 16GB comparison demonstrates how VRAM capacity interacts with CPU-to-GPU data transfer rates in high-IPC gaming scenarios.
Interpreting Results: Common Misreadings
Two common errors corrupt IPC comparisons. First, failing to lock CPU frequency during testing, if one chip turbos higher during the benchmark, the IPC figure absorbs frequency variance and becomes meaningless. Lock both chips to their base clock before measuring. Second, comparing IPC across mismatched workloads, a chip that excels at integer IPC may trail on floating-point IPC. Always compare IPC within the same benchmark on the same build of the same binary. Cross-platform compiler differences (MSVC vs. Clang vs. GCC) can shift perceived IPC by 5 to 12% without any underlying hardware difference.
Final Diagnostic Verdict & Maintenance Checklist
IPC is not a static number stamped on a processor, it is a dynamic figure that changes with workload, compiler quality, memory subsystem latency, firmware version, and thermal headroom. A chip running at 95°C with aggressive power limits engaged is not delivering the IPC it is architecturally capable of. The following checklist consolidates every actionable step to ensure your platform is delivering its rated IPC potential.
- Update BIOS/UEFI firmware: Microcode updates routinely improve branch predictor accuracy and fix errata that cause pipeline flushes, both directly raise effective IPC. Check your board manufacturer’s support page monthly on a new platform.
- Enable XMP/EXPO memory profiles: Running DDR5 at JEDEC base (4800 MT/s) instead of rated XMP (6000 to 7200 MT/s) increases cache miss penalty in wall-clock nanoseconds, reducing effective IPC on memory-bound code by up to 8%.
- Verify CPU cooler contact and thermal paste application: Thermal throttling reduces the sustained clock ceiling, collapsing the IPC u00d7 Frequency product. Keep junction temperature below 90°C under sustained all-core load.
- Check Windows power plan: The “Balanced” power plan allows the processor to park cores and reduce frequency, creating artificial IPC variance in benchmarks. Use “High Performance” or manufacturer-specific plans (AMD Ryzen Balanced, Intel Gaming Mode) for consistent measurement.
- Audit background process load: OS scheduler interference during a benchmark injects cache pollution and branch history corruption that artificially deflates measured IPC. Use process isolation or a minimal boot environment for production benchmarking.
- Compile software with architecture-specific flags: -march=native on GCC/Clang enables AVX-512, BMI2, and other ISA extensions that can double IPC on vectorizable inner loops. Pre-built binaries rarely target the highest available ISA level.
- Validate results with multiple benchmark tools: No single benchmark reveals the full IPC profile. Cross-reference SPECint single-thread, Cinebench R24 ST, and a workload from your specific use case before drawing conclusions.
- Account for E-core IPC on hybrid architectures: Intel’s Arrow Lake and Alder Lake mix high-IPC P-cores with lower-IPC E-cores. Ensure thread scheduling targets P-cores for latency-sensitive workloads; Windows 11’s Thread Director handles this automatically, but third-party process affinity tools can override it incorrectly.
The central conclusion of any what is CPU IPC analysis is this: gigahertz is a rate, IPC is a yield, and performance is their product. Buying the highest-clocked processor without examining the architectural generation behind it is equivalent to choosing an engine by RPM ceiling without checking displacement or valve timing. In 2026’s pc hardware landscape, where generational IPC leaps of 15 to 20% are common and frequency scaling has slowed, IPC is the decisive variable. Measure it correctly, contextualize it to your workload, and the right CPU choice becomes unambiguous.
Clock Speed and Work Terms
Instructions per clock describes how much work a processor completes in each cycle, which is one reason clock speed alone does not tell the whole story. Background on computing terms is listed at American National Standards Institute (ANSI).