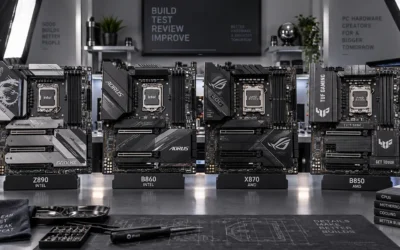

CPU temperature monitoring is a non-negotiable component of Windows 11 system maintenance and performance diagnostics. Whether you’re troubleshooting thermal throttling, validating cooling system performance, or establishing baseline metrics for an overclock, accurate temperature telemetry is your first line of defense against silicon degradation and unexpected shutdown events. This guide provides hardware architects, enthusiasts, and general users with battle-tested methods to extract, interpret, and act upon CPU temperature data in Windows 11 environments.
Quick Answer
Check CPU temperature in Windows 11 via Windows 11’s native Task Manager (limited), or deploy free third-party tools: HWiNFO64 (professional-grade accuracy), Core Temp (per-core precision), or Ryzen Master/Intel XTU (manufacturer utilities). Real-time monitoring reveals thermal stability; temperatures above 95°C under load indicate cooling insufficiency requiring immediate intervention.

Pros
- 14-core hybrid architecture with 6 P-cores and 8 E-cores
- Unlocked clock speeds up to a rated 5.2 GHz
- Equipped with 26MB cache for responsive processing
- Supports modern PCIe 5.0 and 4.0 standards
- Compatible with Intel 800 series motherboards
Cons
- Requires a dedicated discrete graphics card
- Does not include a cooling solution

Pros
- 24 cores (8 P-cores, 16 E-cores) and 32 threads for intense multitasking
- Advertised maximum clock speed reaching up to 6.0 GHz
- Broad compatibility with both DDR4 and DDR5 memory platforms
- Features integrated Intel UHD Graphics 770
Cons
- Requires a potential BIOS update for Intel 600-series motherboards

Pros
- High 5.4 GHz max boost is well suited to gaming workloads.
- Unlocked multiplier gives experienced users tuning headroom.
- AM5 and DDR5 support align with current-generation desktop platforms.
- 6-core, 12-thread layout is practical for gaming and general use.
Cons
- Cooler is not included, so buyers must plan for separate cooling.
- Requires an AM5 motherboard and DDR5 memory, which limits drop-in upgrades for older systems.
- 6 cores may be less ideal for heavy content creation or workstation tasks than higher-core CPUs.
Overview: The AMD Ryzen 5 9600X is a 6-core, 12-thread unlocked desktop processor built on the Zen 5 architecture. It is aimed at users who want a fast, modern CPU for an AM5-based gaming PC or a responsive everyday desktop build.
Performance and features: With a 5.4 GHz max boost, 38 MB cache, and DDR5-5600 support, this processor is positioned for strong gaming responsiveness and smooth multitasking. Select AM5 motherboards can also provide PCIe 5.0 support, which adds future-ready flexibility for compatible components.
Drawbacks and considerations: The main limitation is that a cooler is not included, so total build cost can rise once cooling is added. It also depends on the AM5 platform and DDR5 memory, which makes it less convenient for older AMD or Intel system upgrades.
Verdict: This CPU makes the most sense for gamers and PC builders who want a fast, unlocked Ryzen chip for a current-generation AM5 system. If you want a straightforward upgrade path and value high boost clocks over bundled extras, the Ryzen 5 9600X is a strong fit.
Understanding CPU Temperature Measurement Standards
Thermal Sensor Architecture & Accuracy
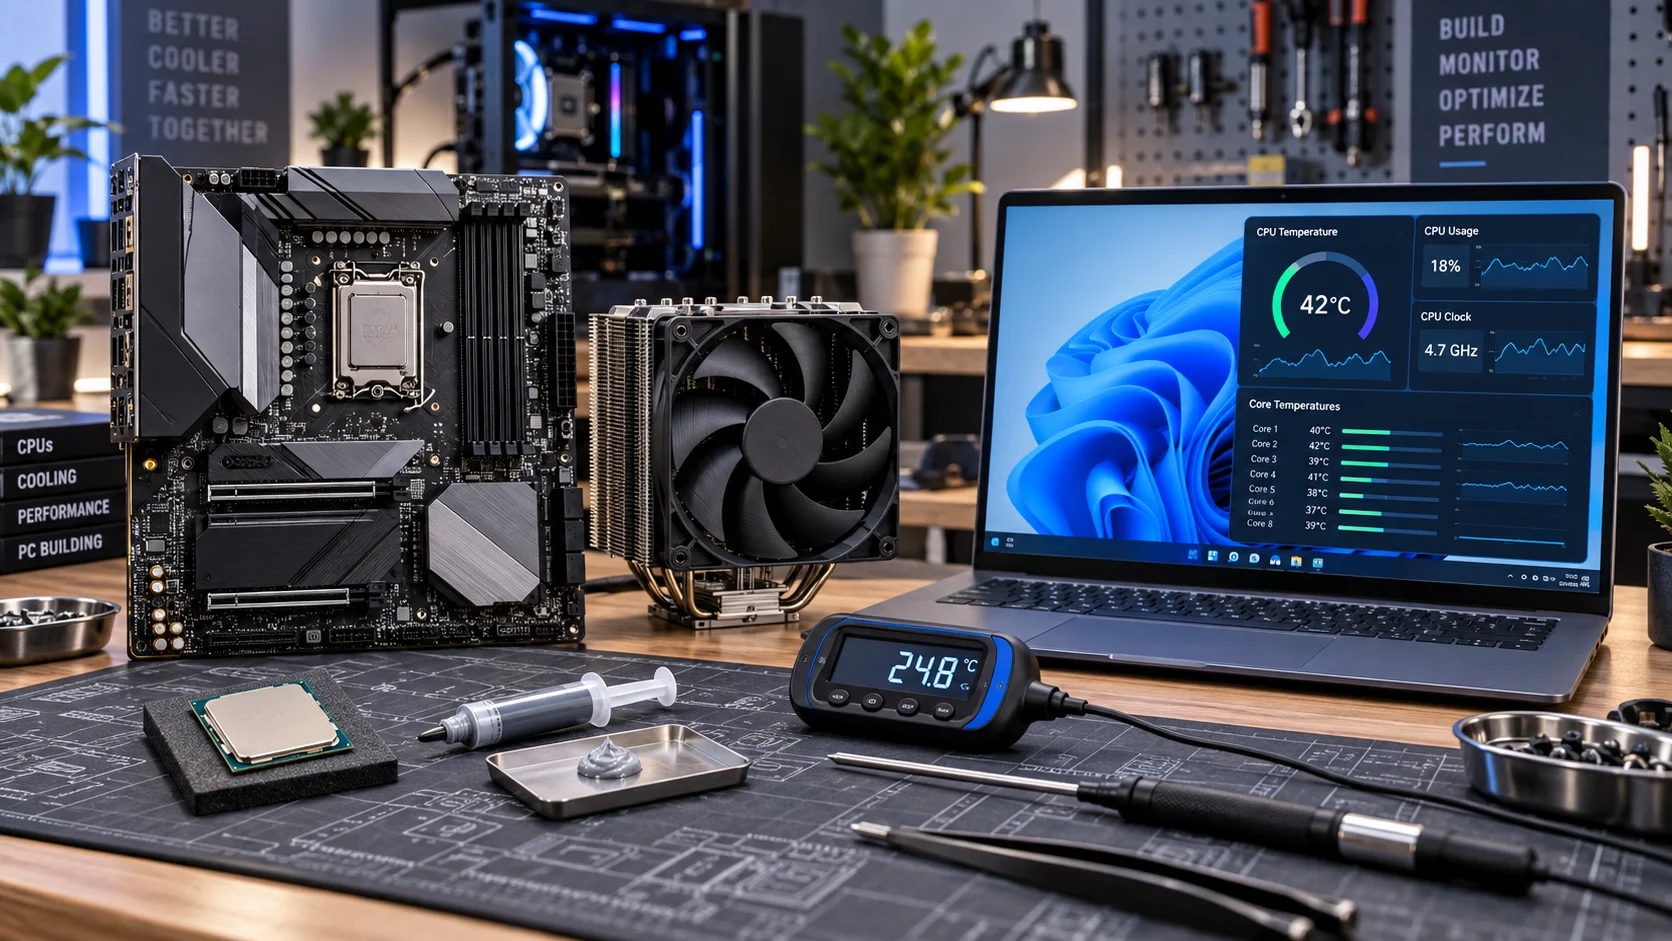
Modern CPUs employ embedded digital thermal sensors (DTS) positioned within the die itself, typically near the power delivery substrate. These sensors report junction temperature (Tj or Tcore), which represents the actual silicon temperature at the measurement point. Windows 11 accesses this data through the Windows Management Instrumentation (WMI) interface, specifically the Win32_TemperatureProbe class, though native OS exposure remains deliberately limited for consumer-grade applications. For broader ecosystem context, read through our operational guide on custom cpu fan curve.
Accuracy variance depends on sensor proximity to high-power density regions. Modern Intel Core Ultra and AMD Ryzen 5 9600X architectures employ distributed thermal monitoring across multiple die sections, introducing u00b12–5°C calibration tolerance. Third-party tools decode manufacturer-specific sensor protocols (Intel’s Digital Thermal Sensor format vs. AMD’s Tcalc methodology), explaining why different applications report slightly divergent readings from identical hardware.
Thermal Specification Boundaries
Intel and AMD publish distinct maximum junction temperatures (Tjunction-max) ranging from 100°C to 120°C depending on process node and microarchitecture. Sustained operation above 85°C accelerates electromigration degradation; silicon reliability degrades exponentially above 90°C. Windows 11 lacks native thermal warning thresholds, making independent monitoring essential to prevent irreversible damage before automatic throttling engages.
Native Windows 11 Temperature Monitoring Methods
Task Manager Hardware Monitoring (Limited)
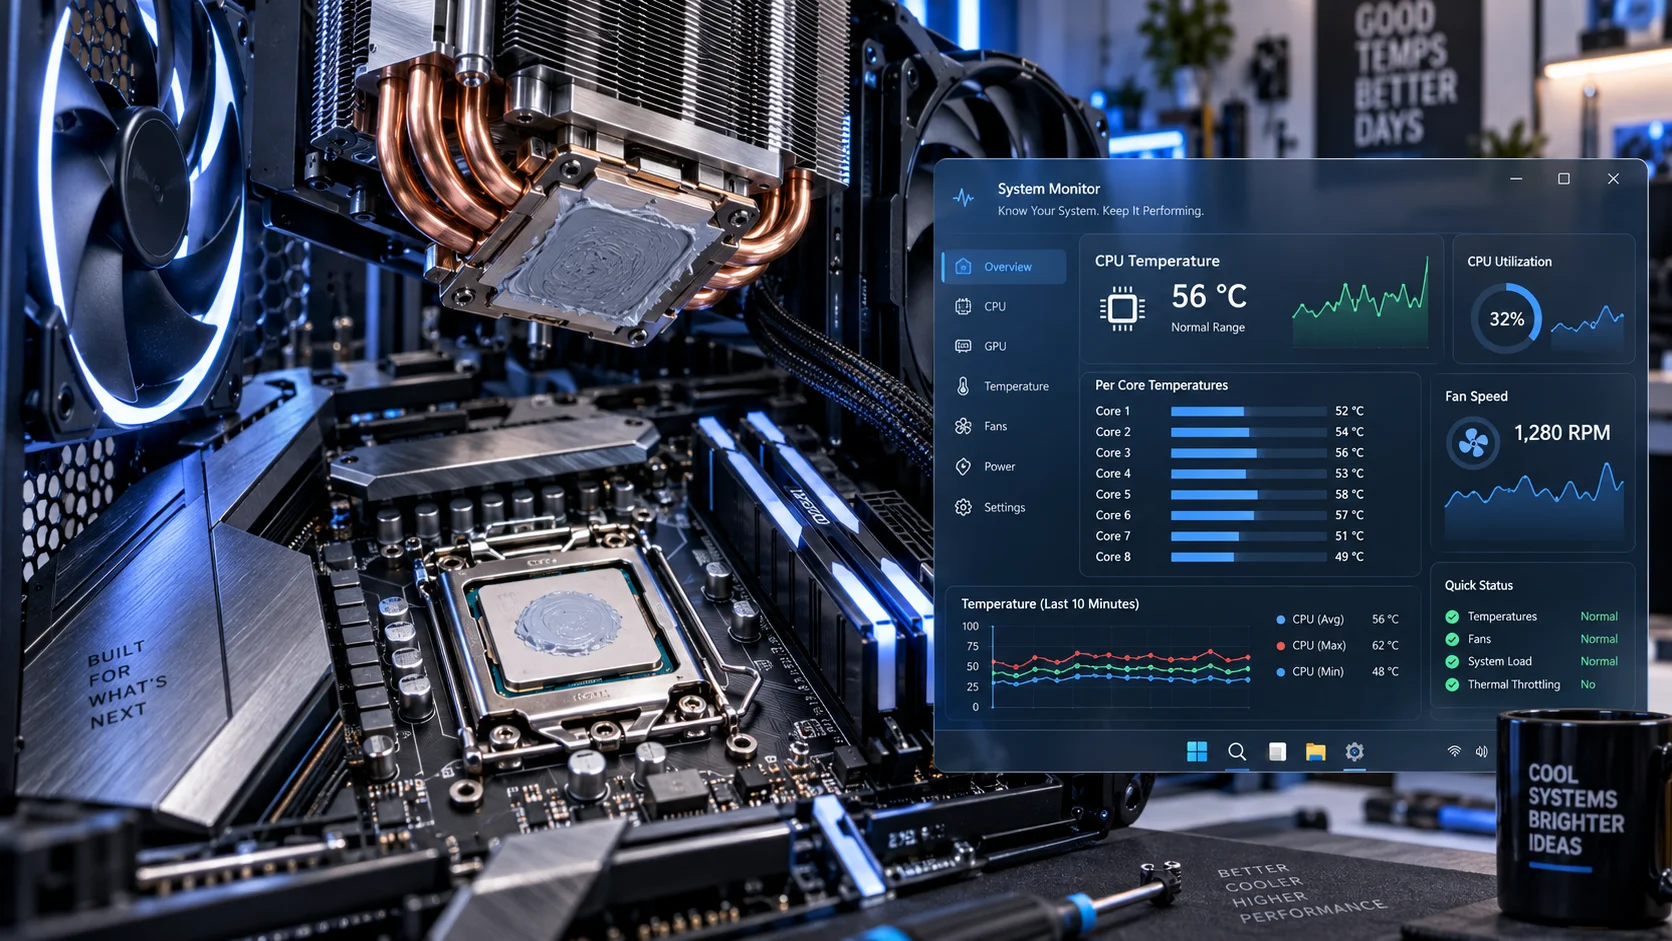
Windows 11 Task Manager includes a GPU temperature widget in the Performance tab, but CPU temperature exposure requires system configuration modification. To enable CPU temperature in Task Manager: right-click the taskbar, select Taskbar settings, navigate to Taskbar items, toggle System monitoring on, then select which metrics display (CPU temperature may not appear depending on motherboard UEFI implementation and sensor availability). For troubleshooting and reliability insights, consult our in-depth how to choose cpu cooler report.
This method provides read-only, non-persistent data without logging capacity or granular per-core breakdown. For baseline thermal observation during casual workloads, Task Manager suffices; for diagnostic-grade monitoring, alternative tools are mandatory.
PowerShell WMI Query Method
Advanced users can extract raw thermal sensor data directly via PowerShell using WMI queries. Execute the following command in PowerShell (Administrator mode): Readers comparing setup options can review our technical analysis on thermal paste shelf life.
Get-WmiObject MSAcpi_ThermalZoneTemperature -Namespace “root/wmi” | Select-Object InstanceName, @{Name=”Celsius”;Expression={(.CurrentTemperature – 2732) / 10}}
This returns all available thermal zones recognized by Windows 11’s ACPI firmware layer. Output accuracy depends entirely on motherboard BIOS implementation; some OEM boards report chipset temperature rather than CPU junction temperature. No real-time streaming capability exists; each query execution requires manual re-run. For complementary field maintenance guidelines, examine our breakdown of what is cpu ipc.
Professional-Grade Third-Party Monitoring Tools
HWiNFO64: Hardware Certification Standard
HWiNFO64 represents the industry standard for professional hardware monitoring, widely deployed by overclockers, system integrators, and data center technicians. The tool decodes CPU-specific thermal sensor protocols with sensor-level granularity, displaying die temperature, package temperature, and per-core thermal margins simultaneously. HWiNFO64 accesses low-level hardware interfaces (including direct CPU MSR reads) to retrieve manufacturer-calibrated temperature coefficients.
Key features include: real-time graphing with customizable update intervals (100ms to 10-second granularity), historical logging to CSV format for thermal trend analysis, alert triggering at user-defined temperature thresholds, and detailed sensor metadata (calibration offset, physical location within the die). The portable version requires no installation, critical for diagnostics on restricted corporate networks. To evaluate matched hardware tolerances, consult our detailed overview of bad psu damage cpu.
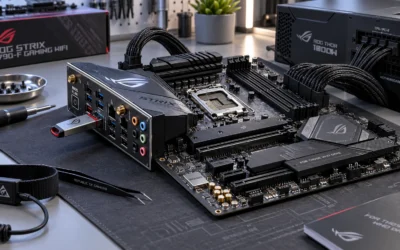
Supported platforms: Intel processors (6th Gen Core and newer), AMD Ryzen (1000-series and current), and compatibility with ASUS ROG Maximus Z890 Hero and competing enthusiast platforms. Typical temperature reporting accuracy: u00b11–2°C when compared against calibrated external thermal cameras.
Core Temp: Per-Core Precision Monitoring
Core Temp specializes in per-core thermal extraction from Intel and AMD CPUs, displaying individual core temperatures alongside a weighted package temperature average. The tool reads Digital Thermal Sensor (DTS) values directly from CPU MSRs, bypassing Windows kernel thermal abstraction layers. This methodology delivers microsecond-level temperature sampling without OS-induced latency.
Core Temp’s logarithmic averaging algorithm prevents misleading spikes from transient thermal events; a single core thermally spiking to 95°C for 10ms won’t artificially elevate the reported package temperature. Historical graphs overlay all cores simultaneously, immediately revealing thermal imbalance scenarios (indicating mounting pressure inconsistencies or paste degradation).
Critical limitation: Core Temp does not support AMD’s Ryzen Threadripper processors reliably; Ryzen desktop CPU support is solid. Download the portable EXE for immediate deployment without administrative privileges.
Ryzen Master & Intel XTU: Manufacturer-Native Utilities
AMD’s Ryzen Master and Intel’s eXtreme Tuning Utility are official manufacturer applications providing temperature telemetry as secondary functionality. Ryzen Master displays comprehensive Ryzen CPU metrics including die temperature, socket temperature, and per-CCD (Core Complex Die) granularity. The interface includes overclocking profiles integrated with thermal monitoring, allowing real-time observation during frequency optimization.
Intel XTU similarly offers per-core temperature, package temperature, and thermal headroom calculations (displayed as degrees C until thermal limit). Both utilities require installation of chipset drivers for full sensor access; bare temperature reading without driver installation may fail on some boards.
Advantage: native manufacturer calibration ensures zero sensor interpretation ambiguity. Disadvantage: installation footprint and occasional driver conflicts with third-party OC utilities.
Temperature Interpretation & Diagnostic Matrices
Thermal Profile Classification Table
| Temperature Range | Workload Status | Cooling Assessment | Required Action |
|---|---|---|---|
| 35–50°C (idle/light use) | Normal thermal baseline | Adequate passive/active cooling | No intervention required; reference point for thermal margin |
| 51–70°C (sustained gaming/productivity) | Normal operational range | Cooling performing within design envelope | Maintain monitoring; no corrective action |
| 71–85°C (rendering, stream encoding, OC) | Elevated sustained load | Cooling at 70–80% capacity; margin exists | Monitor for throttling; consider airflow optimization |
| 86–95°C (sustained) | High thermal stress | Cooling marginal; approaching thermal throttling threshold | Immediate action: increase fan speed, improve case airflow, check thermal paste condition |
| 96–100°C (sustained) | Critical thermal condition | Cooling inadequate; silicon at risk | URGENT: reduce workload immediately, suspend overclocking, re-paste CPU, verify cooler mounting pressure |
| 101°C+ (any sustained period) | Severe thermal failure | Cooling failure or catastrophic hardware defect | CRITICAL: power down immediately, inspect for cooler detachment, verify pump functionality (AIO), check for bent socket or cooler contact obstruction |
Diagnostic Scenarios & Root Cause Analysis
Asymmetrical core temperatures (variance exceeding 10°C between cores at identical workload) indicate: thermal paste degradation with localized contact loss, cooler mounting misalignment causing uneven pressure distribution, or airflow obstruction affecting specific cooler fins. Deploy HWiNFO64’s graphing feature to log 5–10 minutes of full-core temperatures during consistent load; visual inspection of per-core trends immediately reveals mechanical contact degradation.
Rapid temperature spikes (jumping 15–20°C within 1–2 seconds) suggest inadequate thermal mass in the cooling solution or transient power delivery noise causing momentary junction temperature elevation. This scenario is normal in high-frequency boost scenarios (single-core turbo frequency engagement); concern arises only if spikes exceed thermal specification limits or trigger unexpected throttling.
Temperatures climbing progressively over 30–60 minute periods indicate thermal paste drying, pump cavitation in AIO coolers, or dust accumulation in cooler fins. Collect baseline thermals on day one post-installation; compare against identical workload after 6–12 months to detect gradual degradation requiring maintenance.
Advanced Temperature Monitoring Strategies
Logging & Trend Analysis for Long-Term Diagnostics
Professional diagnostics require historical temperature data across extended timescales. HWiNFO64’s CSV export functionality enables external analysis: configure 1–5 minute sensor polling intervals, run monitoring during typical workloads (gaming sessions, video encoding, productivity), then export to CSV format for import into spreadsheet applications or dedicated thermal analysis software.
Establish baseline metrics within 48 hours of system assembly: record idle temperature, temperature at 50% sustained load, and maximum temperature reached during synthetic stress-testing (Prime95, MemTest86+, or Cinebench). Document ambient room temperature alongside each measurement; thermal performance scales linearly with environmental temperature (approximately 0.5–1°C per degree Celsius of ambient variation).
Repeat identical baseline measurements every 6 months; any degradation exceeding u00b13°C indicates cooling system maintenance requirement. Compare thermal metrics against reference builds from desktop CPU benchmarks & reviews to identify outlier performance requiring investigation.
Thermal Margin Calculation & Overclocking Limits
Thermal margin represents headroom between current temperature and maximum junction temperature specification. Calculate margin as: Thermal Margin = Tjunction-max u2212 Current Temp. Intel 12th-14th Gen processors specify Tjunction-max of 100°C; AMD Ryzen 7000-series specify 95°C. Operating with less than 15°C margin under sustained loads introduces degradation risk; overclocking requires minimum 20–25°C margin for silicon longevity.
When validating GPU-CPU thermals in paired systems, monitor both components simultaneously; GPU memory or power delivery thermals often spill heat into the CPU socket area, raising junction temperature 3–8°C above isolated measurements. Integrated GPU-CPU air handling requires system-level airflow modeling, not isolated component assessment.
Troubleshooting Abnormal Temperature Readings
Sensor Misreporting & Software Validation
Conflicting temperature readings between monitoring tools indicate either sensor calibration variance or software interpretation error. Cross-validate by running three independent tools simultaneously: HWiNFO64, Core Temp, and manufacturer utility (Ryzen Master or Intel XTU). Acceptable variance: u00b13°C between tools. Variance exceeding u00b15°C suggests sensor malfunction or defective temperature probe within the CPU.
BIOS-reported CPU temperature (accessible via motherboard UEFI firmware, not Windows) represents the authoritative reference. If Windows-based tools report temperatures 10°C+ higher than BIOS display, the Windows sensor driver may be reading chipset thermal zones rather than junction temperature. Verify in Device Manager u2192 Sensors u2192 confirm “CPU Temperature” entries show CPU PN (processor number), not chipset model.
Phantom temperature sensors occasionally appear following driver updates on boards with integrated RGB/chipset monitoring; these report fixed incorrect values (often 0°C or 127°C). Ignore entries labeled “Chipset Temp,” “VRM Temp,” or unlabeled numeric sensors; focus exclusively on “CPU Package” or “CPU Die” entries.
Temperature Not Displaying or Fluctuating Erratically
Missing temperature data typically indicates: chipset driver not installed (required for ACPI thermal zone exposure), BIOS setting disabling thermal sensor access (enable in Power Management section of firmware), or Windows WMI thermal service disabled. Verify WMI integrity by executing wmic logicaldisk list full in Command Prompt (Administrator); if this returns no results, WMI installation is corrupted requiring OS repair.
Erratic temperature fluctuation (u00b115°C swings within 1–2 seconds during idle) points to: BIOS dynamic fan control engaging at aggressive thresholds, CPU Power States (C-States) transitioning rapidly between frequency and voltage states, or monitoring tool polling interval misaligned with sensor update frequency. Disable C-States in BIOS Power Management temporarily to verify if erratic behavior persists; if eliminated, adjust fan curve aggressiveness in BIOS rather than expecting stable software monitoring under unstable firmware conditions.
Integration with System Monitoring Dashboards
Real-Time Overlay Monitoring During Gaming
NVIDIA’s FrameView and Intel Architecture Technical Documentation reference implementations enable real-time GPU-CPU temperature overlay during gameplay. HWiNFO64 integrates with RTSS (RivaTuner Statistics Server) to display CPU temperature, GPU temperature, and frame rate on-screen simultaneously without dedicated monitoring window. Configuration: launch RTSS, enable On-Screen Display (OSD) in settings, select HWiNFO64 sensor source, customize overlay position and text color.
This methodology validates thermal behavior under actual gaming conditions rather than synthetic benchmarks. Deploy during 30–60 minute gaming sessions to identify thermal stability at consumer-relevant workload intensity. Temperature should stabilize within 5–10 minutes and remain flat thereafter; progressive temperature climb indicates insufficient cooling or thermal paste degradation requiring remediation.
Final Diagnostic Verdict & Maintenance Checklist
CPU temperature monitoring in Windows 11 requires multi-method validation to ensure accuracy and reliability. Begin with native OS tools (Task Manager, PowerShell WMI) for quick baseline assessment; deploy HWiNFO64 or Core Temp for professional-grade diagnostics when investigating thermal anomalies. Establish temperature baselines within 48 hours of system assembly, log trends at 6-month intervals, and maintain thermal margin above 20°C under sustained loads.
Temperature readings above 85°C during sustained workloads demand immediate investigation. Follow this maintenance protocol systematically:
- Inspect CPU cooler base plate for dust, debris, or thermal paste residue—clean with isopropyl alcohol (90%+) on lint-free cloth
- Verify cooler mounting pressure: check retention bracket tension, confirm no mounting brackets bent or loose
- For AIO coolers: verify pump power connector fully seated, listen for audible pump operation, check radiator fan speed (BIOS fan control menu)
- Evaluate case airflow: verify intake fans spinning, check for blocked vent areas or cable management obstructing airflow paths
- If temperatures remain elevated post-inspection: de-mount cooler, clean old thermal paste completely from CPU and cooler base plate, apply fresh thermal paste (0.5–1g application only), re-mount with calibrated pressure
- Re-run baseline thermal testing; temperatures should normalize within 3–5°C of original installation baseline
Document all thermal measurements in a local spreadsheet alongside ambient temperature, time of measurement, and workload type. This historical record enables early detection of cooling system degradation, supporting predictive maintenance before catastrophic failure. Monitor graphics card tests & GPU guides alongside CPU metrics when diagnosing system-level thermal interactions in GPU-accelerated workloads.
Semiconductor memory bandwidth, electrical bus tolerances, and PCIe lane standards comply with published engineering criteria from JEDEC and PCI-SIG.
Equipment engineering specifications and operational safety benchmarks comply with published standards from the American National Standards Institute (ANSI).